Deploy Cloud-Native Monitoring Application on Kubernetes

I am excited to continue my learning journey in DevOps. I believe that DevOps is the future of software development, and I am excited to be a part of the movement.
Introduction
In this blog post, we will embark on an exciting hands-on project to Deploy a Monitoring application on Kubernetes. Throughout this project, we will learn and implement various tools, and technologies like AWS ECR, AWS EKS, and Boto3. This hands-on project is perfect for beginners and intermediate-level developers who are looking to enhance their skills and gain valuable experience. So, let's dive in and get started!
Prerequisites
Before we begin, make sure you have the following prerequisites set up:
AWS Account with IAM user, roles, and access key activated
Ubuntu OS(Recommended)
Docker Installed
Kubectl Installed
Python3 Installed
VS Code(Recommended)
Create AWS IAM Role and attach EKS permissions to it
Create IAM Role

Add Use Cases as
EKSandEKS- Cluster
Just click
Next,NextandCreatethe roleNow select the
EKS-rolewe created and edit it to add permissions
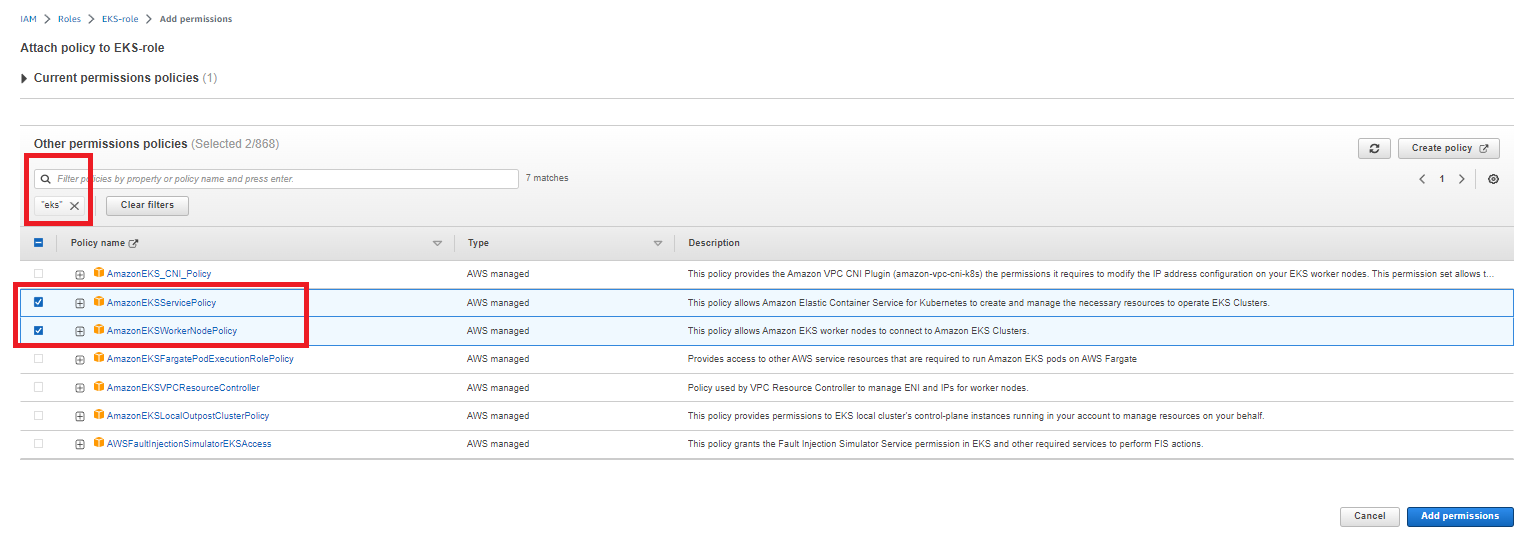
Click
Add permissionand you are done with role creation.
Configure your AWS CLI in your Ubuntu system
First, create your Access Key in IAM
Open the IAM console at https://console.aws.amazon.com/iam/.
On the navigation menu, choose Users.
Choose your IAM user name (not the check box).
Open the Security credentials tab, and then choose Create access key.
To see the new access key, choose Show. Your credentials resemble the following:
Access key ID:
AKIAIOSFODNN7EXAMPLESecret access key:
wJalrXUtnFEMI/K7MDENG/bPxRfiCYEXAMPLEKEY
To download the key pair, choose Download .csv file. Store the .csv file with keys in a secure location.
Now Using aws configure configure your Terminal to use AWS credentials to access your AWS console
aws configure
you will see the input interface in the terminal and add Access Key ID then add Secret Access key then add Default Region as us-east-1 and skip the Default Output by pressing Enter , Now your AWS configuration is successful
Refer bellow,
AWS Access Key ID [None]: AKIAIOSFODNN7EXAMPLE
AWS Secret Access Key [None]: wJalrXUtnFEMI/K7MDENG/bPxRfiCYEXAMPLEKEY
Default region name [None]: us-east-1
Default output format [None]:
Project Overview
In this section, we will provide an overview of the project and its objectives.
- Objective 1: Creating a monitoring application with
index.htmlin HTML andapp.pyin Python using Flask and PSUTIL
PSUTIL (process and system utilities) is a cross-platform library for retrieving information on running processes and system utilization (CPU, memory, disks, network, sensors) in Python
Objective 2: Creating
ecr.pyto configure our AWS Elastic Container Repository,eks.pyto configure AWS Elastic Kubernetes Clusters andDockerfile, andrequirement.txtto create our Docker Image.Objective 3: Kubernetes Deployment
Step-by-Step Implementation
Step 1: Create an app.py application in Python and index.html
We code using Python's Flask framework to get information about CPU and Memory using the psutil library and an index.html file for a User Interface
app.py
import psutil
from flask import Flask, render_template

app = Flask(__name__, template_folder='Template')

@app.route("/")
def index():
    cpu_metric = psutil.cpu_percent()
    mem_metric = psutil.virtual_memory().percent
    Message = None

    if cpu_metric > 80 :
        Message = "High CPU usage Detected, Scale UP!"
    elif mem_metric > 80 :
        Message = "High Memory usage Detected, Scale UP!"
    return render_template("index.html", cpu_metric=cpu_metric, mem_metric=mem_metric, message=Message)


if __name__ == '__main__':
    app.run(debug=True, host='0.0.0.0')
index.html
<!DOCTYPE html>
<html>
<head>
    <title>System Monitoring</title>
    <script src="https://cdn.plot.ly/plotly-latest.min.js"></script>
    <style>
        .plotly-graph-div {
            margin: auto;
            width: 50%;
            background-color: rgba(151, 128, 128, 0.688);
            padding: 20px;
        }
    </style>
</head>
<body>
    <div class="container">
        <h1>System Monitoring</h1>
        <div id="cpu-gauge"></div>
        <div id="mem-gauge"></div>
        {% if message %}
        <div class="alert alert-danger">{{ message }}</div>
        {% endif %}
    </div>
    <script>
        var cpuGauge = {
            type: "indicator",
            mode: "gauge+number",
            value: {{ cpu_metric }},
            gauge: {
                axis: { range: [null, 100] },
                bar: { color: "#1f77b4" },
                bgcolor: "white",
                borderwidth: 2,
                bordercolor: "#ccc",
                steps: [
                    { range: [0, 50], color: "#d9f0a3" },
                    { range: [50, 85], color: "#ffeb84" },
                    { range: [85, 100], color: "#ff5f5f" }
                ],
                threshold: {
                    line: { color: "red", width: 4 },
                    thickness: 0.75,
                    value: {{ cpu_metric }}
                }
            }
        };

        var memGauge = {
            type: "indicator",
            mode: "gauge+number",
            value: {{ mem_metric }},
            gauge: {
                axis: { range: [null, 100] },
                bar: { color: "#1f77b4" },
                bgcolor: "white",
                borderwidth: 2,
                bordercolor: "#ccc",
                steps: [
                    { range: [0, 50], color: "#d9f0a3" },
                    { range: [50, 85], color: "#ffeb84" },
                    { range: [85, 100], color: "#ff5f5f" }
                ],
                threshold: {
                    line: { color: "red", width: 4 },
                    thickness: 0.75,
                    value: {{ mem_metric }}
                }
            }
        };

        var cpuGaugeLayout = { title: "CPU Utilization" };
        var memGaugeLayout = { title: "Memory Utilization" };

        Plotly.newPlot('cpu-gauge', [cpuGauge], cpuGaugeLayout);
        Plotly.newPlot('mem-gauge', [memGauge], memGaugeLayout);
    </script>
</body>
</html>
Test the application in your localhost:5000 and it will show your PC's CPU and Memory metrics
Run the following command:
python3 app.py

OUTPUT:

Step 2: Create a Dockerfile for creating a docker image of our application
Docker can build images automatically by reading the instructions from a Dockerfile. A Dockerfile is a text document that contains all the commands a user could call on the command line to assemble an image. This page describes the commands you can use in a Dockerfile.

requirements.txt
Flask==2.2.3
MarkupSafe==2.1.2
Werkzeug==2.2.3
itsdangerous==2.1.2
psutil==5.8.0
plotly==5.5.0
tenacity==8.0.1
boto3==1.9.148
kubernetes==10.0.1
Dockerfile
FROM python:3.9-buster
WORKDIR /app
COPY  requirements.txt .
RUN pip3 install --no-cache-dir -r requirements.txt
COPY . .
ENV FLASK_RUN_HOST=0.0.0.0
EXPOSE 5000
CMD ["flask", "run"]
Now let's create our Docker Image using following command:
docker build -t my-cloud-native .

Step 3: Create an ecr.py application in Python using boto3
Amazon Elastic Container Registry (Amazon ECR) is a fully managed container registry offering high-performance hosting, so you can reliably deploy application images and artifacts anywhere.
ecr.py
import boto3

client = boto3.client('ecr')
response = client.create_repository(repositoryName="my_cloud_monitoring_system")

repository_uri = response ['repository']['repositoryUri']
print(repository_uri)
Once you run the following command, you will see your ECR Repository is created in your AWS account:
python3 ecr.py
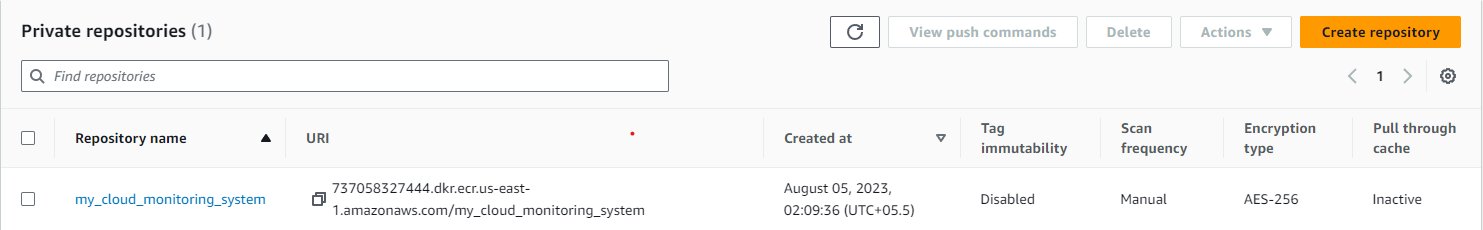
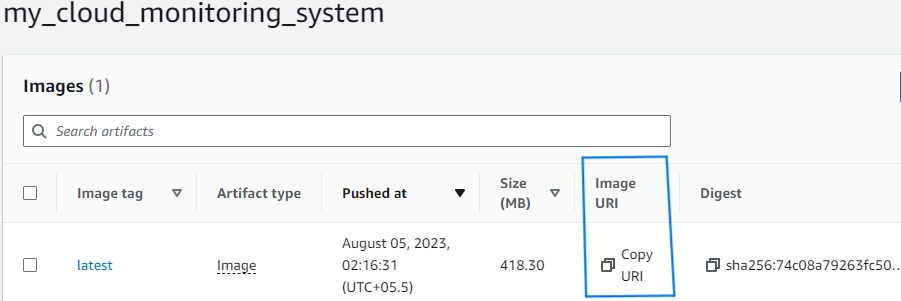
Now push the created Docker Image using the push commands mentioned in your Repository under the tab view push commands and run all the commands one by one.

Once your Image is pushed, look under your repository to see if it has been pushed:

Step 4: Create an AWS EKS configuration file eks.py using
You use the AWS SDK for Python (Boto3) to create, configure, and manage AWS services, such as Amazon Elastic Compute Cloud (Amazon EC2) and Amazon Simple Storage Service (Amazon S3). The SDK provides an object-oriented API as well as low-level access to AWS services.
Before we begin with our AWS Elastic Kubernetes Service
Let's set up our EKS Cluster and its nodes,
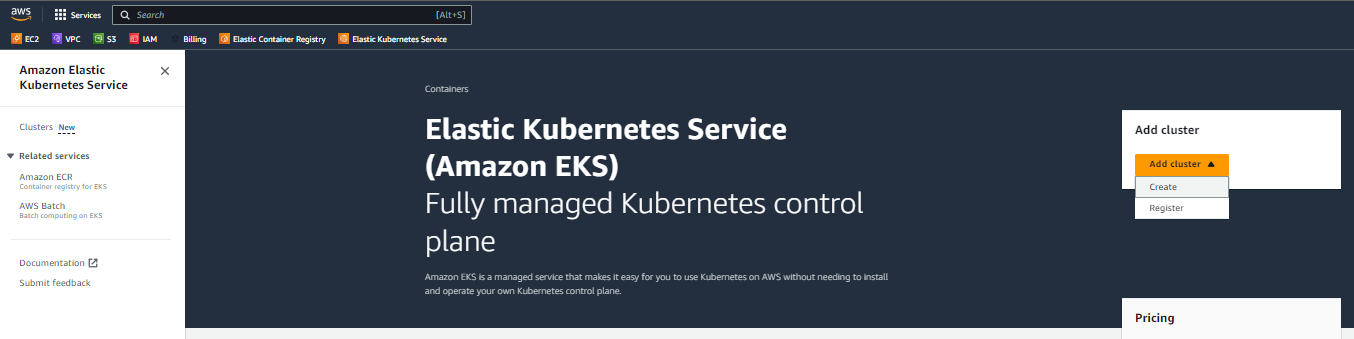
Open your
AWS Elastic Kubernetes Servicetab in AWS and SelectCreateinAdd Cluster
Add cluster name and role as below,

Next, add Network with
us-east-1a,us-east-1b,us-east-1c,us-east-1dsubnets of default VPC and a Security Groupsg,
Then just click
Next,Next,Nextthen clickCreate.Wait for a few minutes as Cluster takes time to get
Active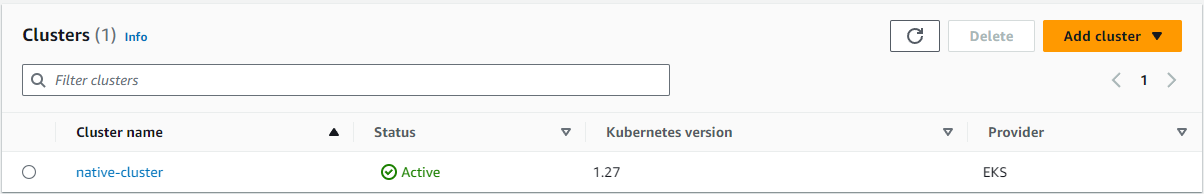
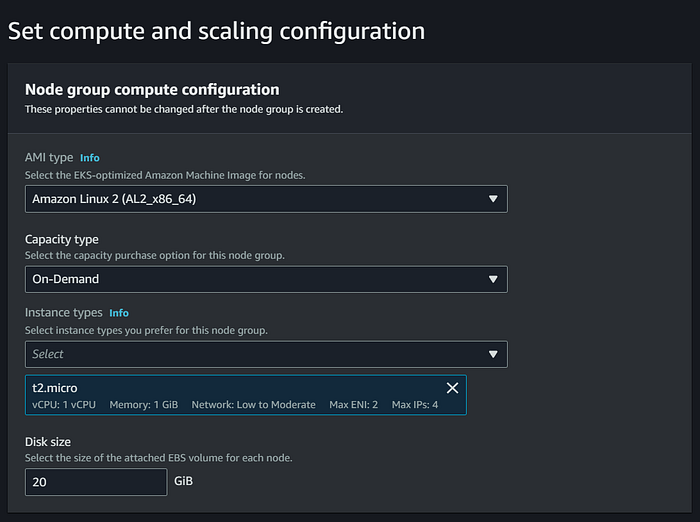
Now Create Nodes
Choose the name of the cluster
native-clusterto manage node group.Select the Compute tab.
Choose Add node group.
On the Configure node group page, fill out the parameters accordingly, and then choose Next.
Keep below configuration of node group,
eks.py
from kubernetes import client, config

config.load_kube_config()
api_client = client.ApiClient()

deployment = client.V1Deployment(
    metadata=client.V1ObjectMeta(name="my-cloud-native"),
    spec=client.V1DeploymentSpec(
        replicas=1,
        selector=client.V1LabelSelector(
            match_labels={"app": "my-cloud-native"}
        ),
        template=client.V1PodTemplateSpec(
            metadata=client.V1ObjectMeta(
                labels={"app": "my-cloud-native"}
            ),
            spec=client.V1PodSpec(
                containers=[
                    client.V1Container(
                        name="my-flask-container",
                        image="737058327444.dkr.ecr.us-east-1.amazonaws.com/my_cloud_monitoring_system:latest",
                        ports=[client.V1ContainerPort(container_port=5000)]
                    )
                ]
            )
        )
    )
)

api_instance = client.AppsV1Api(api_client)
api_instance.create_namespaced_deployment(
    namespace="default",
    body=deployment
)

service = client.V1Service(
    metadata=client.V1ObjectMeta(name="my-flask-service"),
    spec=client.V1ServiceSpec(
        selector={"app": "my-flask-app"},
        ports=[client.V1ServicePort(port=5000)]
    )
)

api_instance = client.CoreV1Api(api_client)
api_instance.create_namespaced_service(
    namespace="default",
    body=service
Add your Image URI in place of image="737058327444.dkr.ecr.us-east-1.amazonaws.com/my_cloud_monitoring_system:latest" in the above file
You can get your Image URI from here,
Now run the below command,
python3 eks.py
Now lets check our deployment using below commands,
kubectl get pods
kubectl get svc -n default
Refer to below output,

kubectl port-forward svc/my-flask-service 5000:5000
Now you have successfully Deployed your Monitoring System
Open localhost:5000 in your Browser. Now you can see the CPU and Memory metric of pods deployed on your AWS cluster node group(EC2 Instance of Linux AMI)
I hope you enjoyed this hands-on project. If you have any questions or face any challenges, feel free to reach out in the comment section.
Credits
To further explore the concepts covered in this hands-on project,


